The cryptocurrency market has been experiencing a bearish sentiment recently, with increased selling pressure across the board. Bitcoin (BTC), the market leader, has struggled to maintain its value above $65,000.
Similarly, Ethereum, the leading altcoin, has seen a period of consolidation in its price action over the past week. Ripple’s XRP coin has also failed to stay above the crucial support level of $0.50.
With the bearish sentiment prevailing among the top cryptocurrencies, the question remains: will the market leaders make a comeback in the coming week or continue to slide towards key support levels?
Bitcoin (BTC):
Bitcoin’s price has shown weakness, with a 1% correction in the past day and a 2.48% drop over the last seven days. The trading volume has also decreased by 61.28%. The EMA 50-day has been acting as a resistance level for BTC, indicating a lackluster price action.
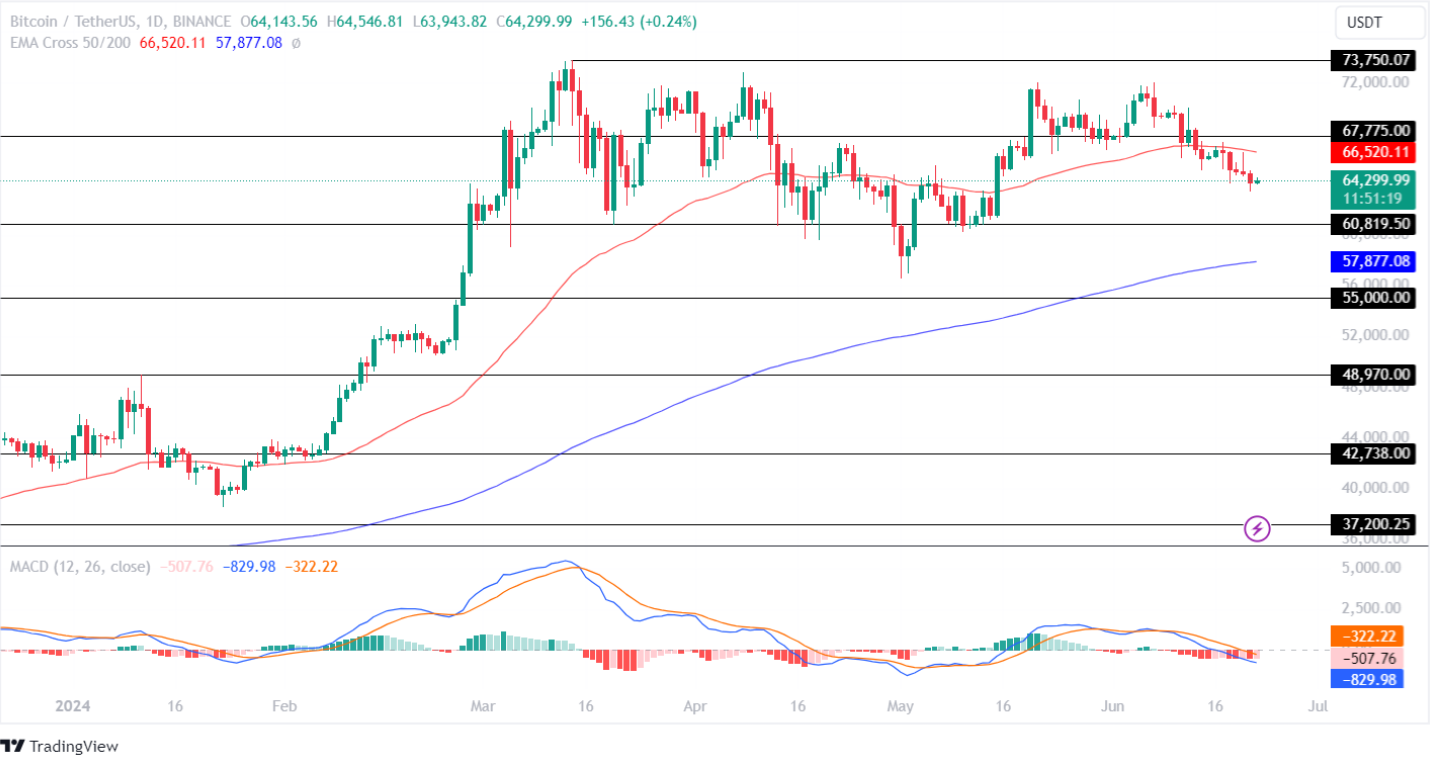
The MACD indicator has been on a downward trend, with the red histogram declining. However, the averages show a mixed price sentiment. If the market gains momentum, Bitcoin could retest the $67,775 resistance level. On the other hand, continued bearish pressure could push the price towards the $60,819.50 support level.
Ethereum (ETH):
Ethereum has been trading sideways for a week and has formed a symmetric triangle pattern in the 1D timeframe. With a 1% drop in valuation in the last 24 hours, ETH is approaching its support trendline with uncertain outcomes.
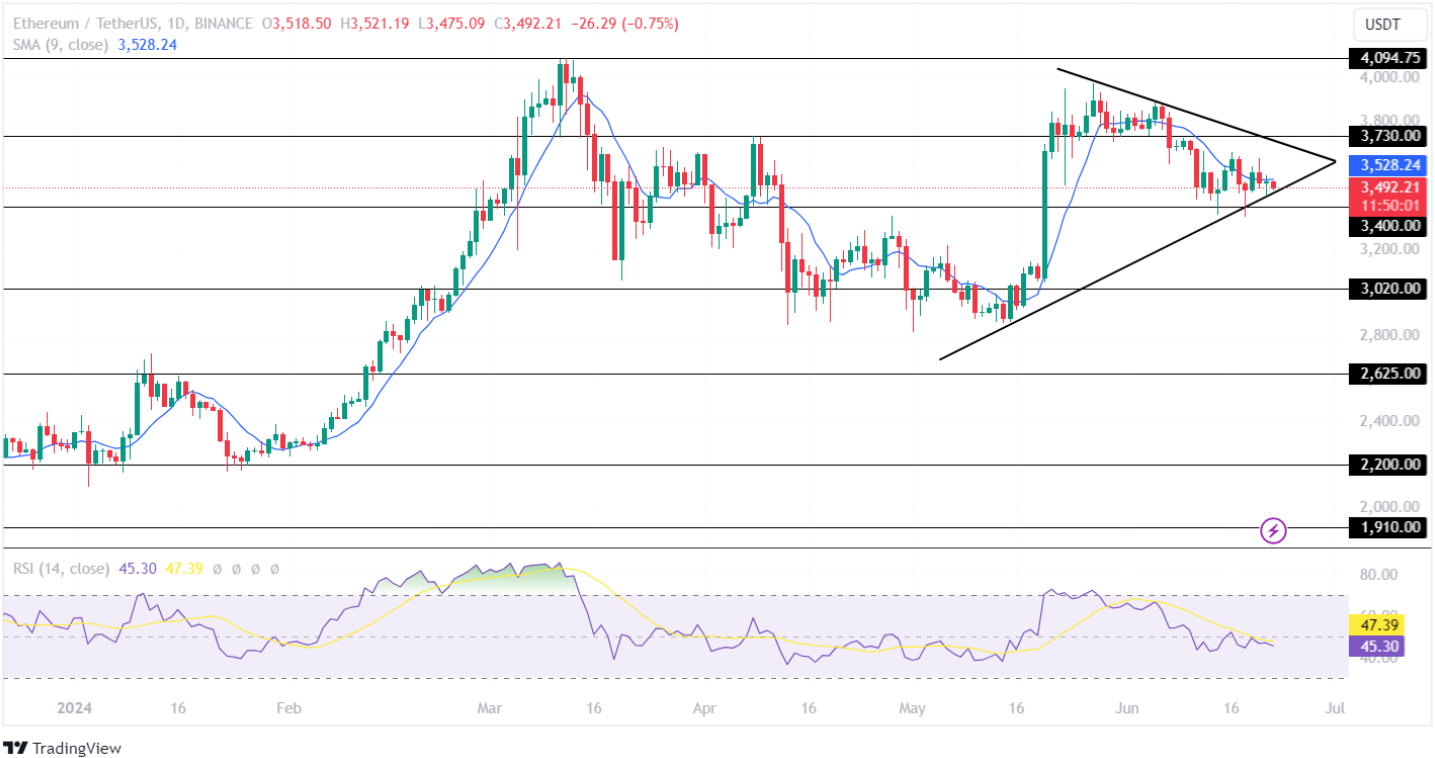
The Simple Moving Average (SMA) has shown a bearish trend for Ethereum, indicating weak bullish sentiment. The RSI indicator is also declining, suggesting waning investor interest in this altcoin.
If the bulls take control, Ethereum could test the $3,730 resistance level. However, if bearish momentum continues, the price may drop below the support trendline towards $3,000.
Ripple (XRP):
Since mid-April, XRP has been trading in a narrow range between $0.480 and $0.5340. The coin has seen minimal movement, with less than a 1% change in the past week and a significant drop in trading volume.
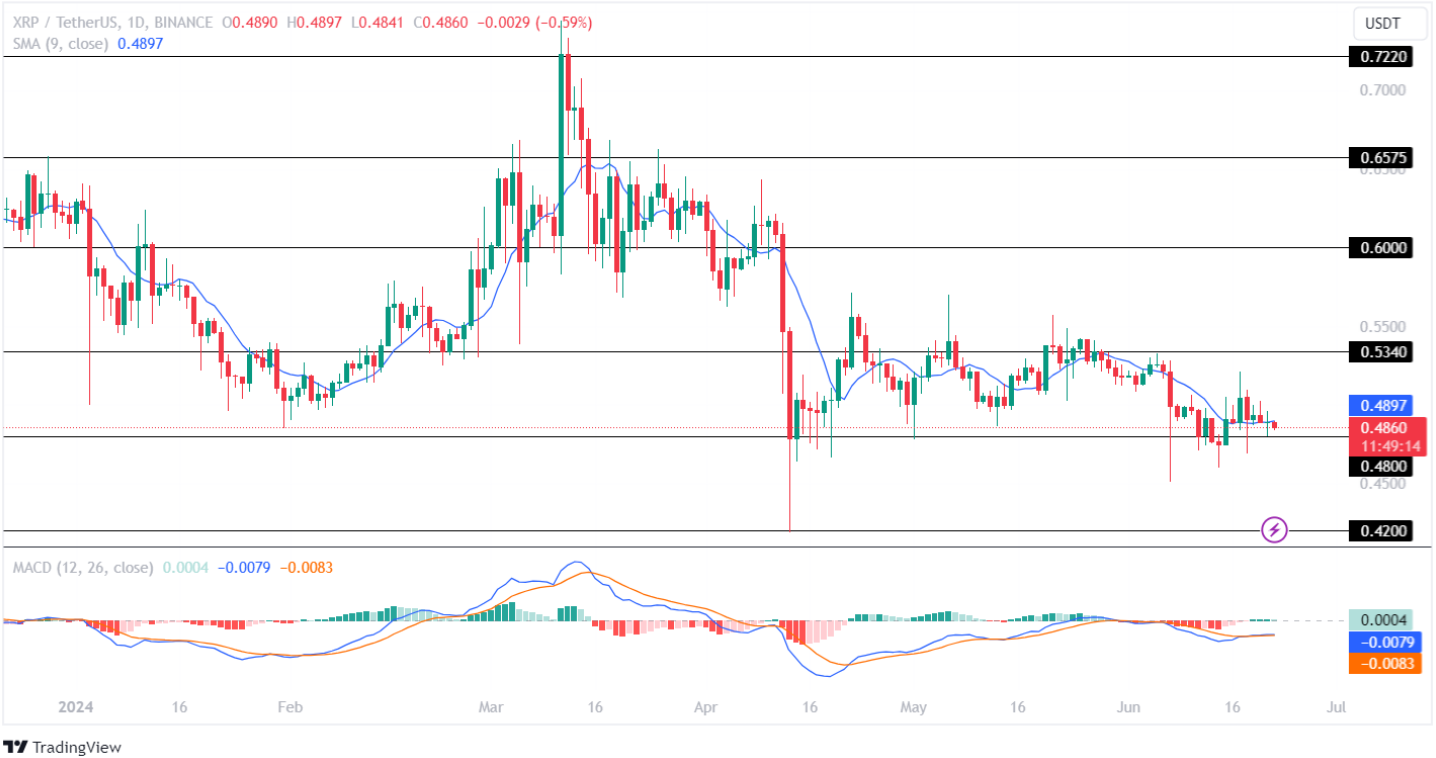
The Moving Average Convergence Divergence (MACD) for XRP shows a flatline, indicating weak buying and selling pressure. The averages suggest uncertainty in future price action. If XRP holds above $0.480, it could test the $0.5340 resistance level. Otherwise, the price may drop towards $0.420 in the coming weeks.