With the cryptocurrency market experiencing increased price volatility, the Solana price has surged by 10.56% in the past seven days, reclaiming momentum. This surge has propelled Solana to become the 4th largest crypto token, surpassing Binance (BNB) coin in market cap.
Following this positive movement, other top SOL-based altcoins have also seen significant price increases in their portfolios. With the current market sentiment, there is speculation on whether the Solana ecosystem will continue its upward trajectory and reach new highs.
In this article, we will explore the top three Solana-based altcoins that show potential for substantial upside in their portfolios.
Jito (JTO):
Jito token has shown strong momentum with a 10% increase in the past 24 hours and a 15.03% surge over the week. It has also delivered a 34.52% gain in the last 30 days and a 70.92% YTD return for long-term investors.
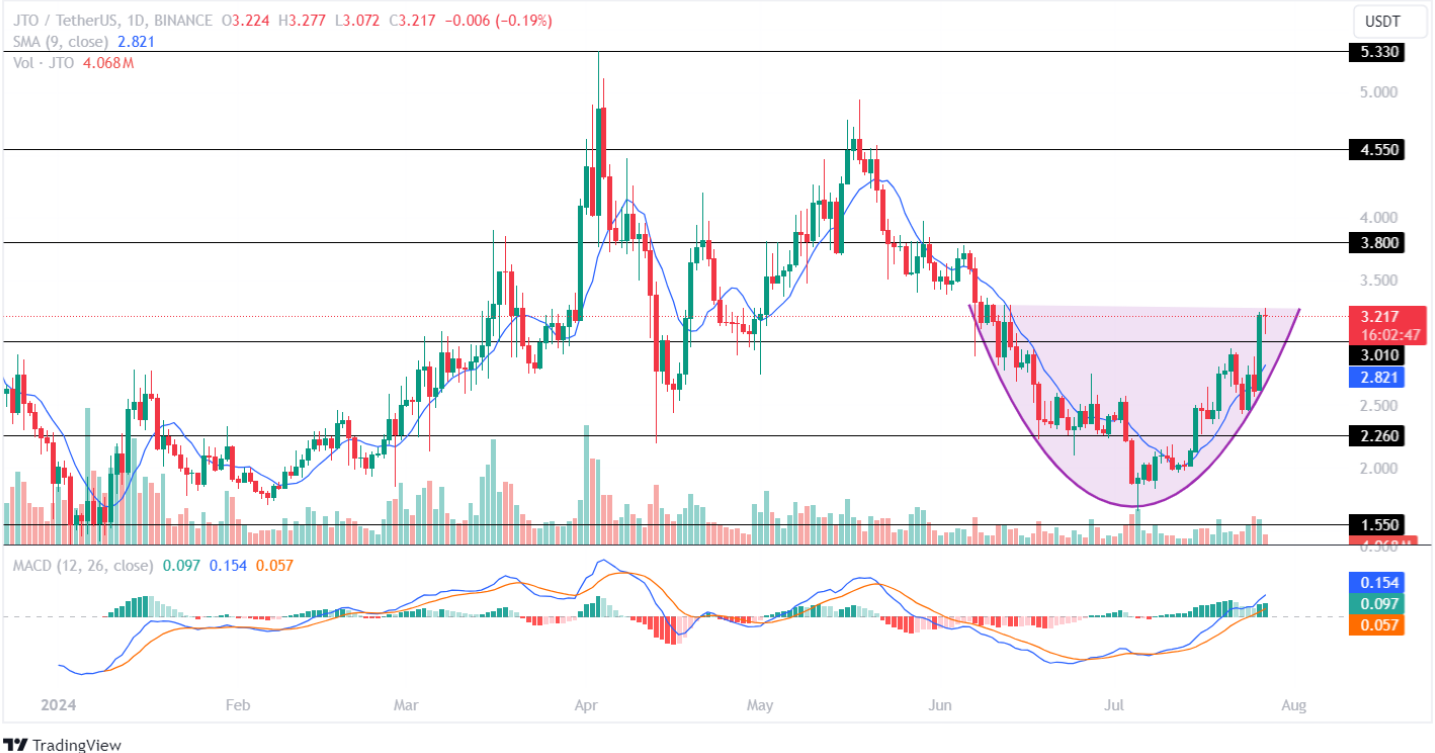
Technical indicators like SMA and MACD have displayed bullish trends in the 1D timeframe, signaling positive momentum in the crypto space.
If Jito price remains above the $3.010 support level, bulls are likely to push it towards the $3.80 resistance. However, a trend reversal could see the price drop to $2.260.
Jupiter (JUP):
Jupiter price has been on a bullish trend, gaining 13.18% in the past day with a trading volume of $167.627 million. It has also surged by 11.71% in the last seven days and 48.04% since its inception.
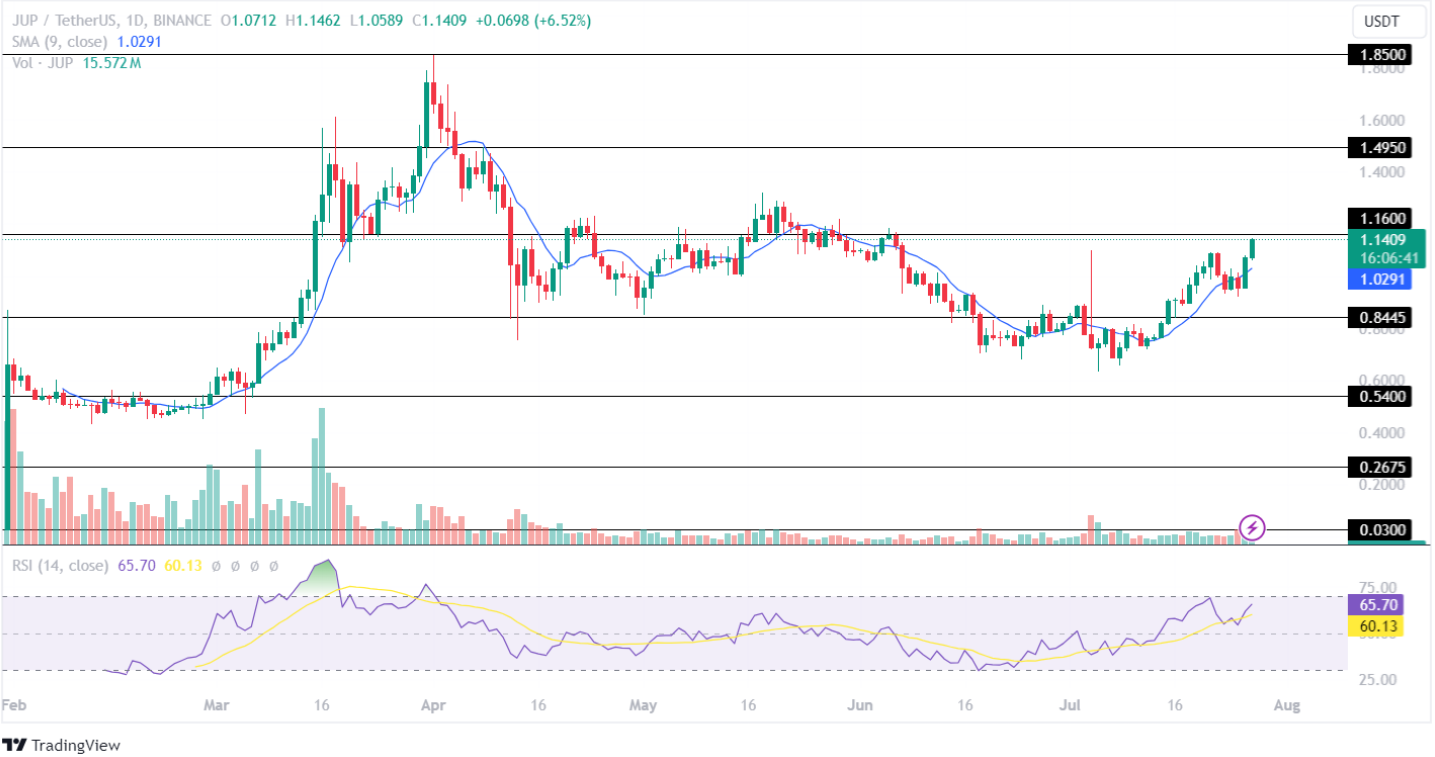
The Relative Strength Index (RSI) shows bullish convergence and a move towards the overbought range, indicating continued positive momentum for JUP price.
If bulls push JUP price above $1.160 resistance, it could target $1.4950. Conversely, a bearish scenario may see the price retesting the $0.8445 support level.
The Graph (GRT):
After a brief bearish period, GRT price has seen a 3% increase, reaching a trading price of $0.1998 and a market cap of $1.910 billion, securing the 51st spot in the top 100 cryptocurrencies.
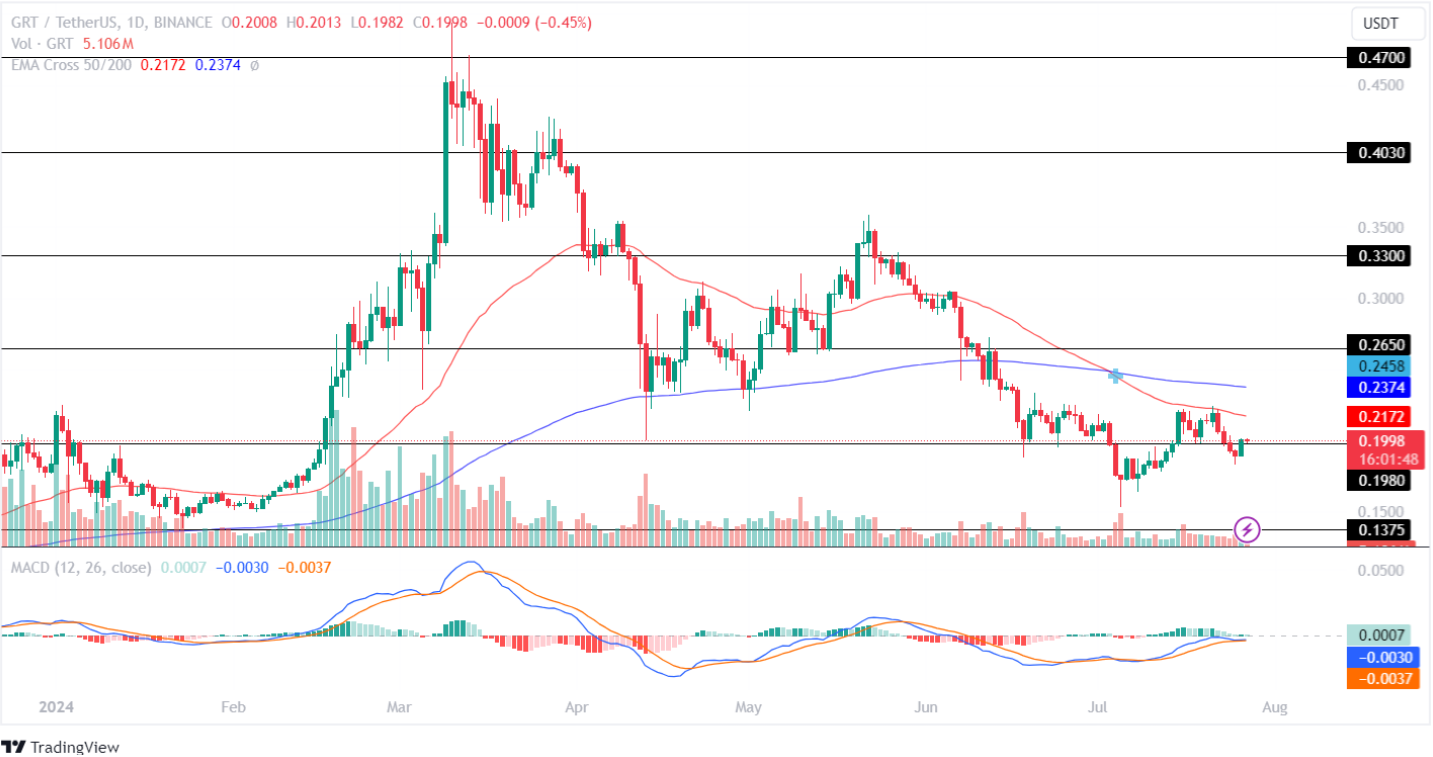
The EMA 50-day acts as resistance for GRT price in the 1D timeframe, indicating bearish pressure in the market.
Although the MACD shows a decline in the green histogram, the averages suggest uncertainty in future price action for The Graph token.
Maintaining price above the support level could lead to a rise towards the $0.2650 resistance, while a bearish scenario might push the price down to $0.1375 support level.