In the midst of a turbulent market sentiment, Shiba Inu (SHIB), the well-known meme coin, is showing signs of a significant price decline as it has formed a bearish price action pattern on its daily chart. This negative sentiment is not limited to SHIB alone, but also extends to other major cryptocurrencies like Bitcoin (BTC), Ethereum (ETH), and Solana (SOL).
Shiba Inu Technical Analysis and Upcoming Levels
Based on CoinPedia’s technical analysis, SHIB is currently bearish as it has broken out of a symmetrical triangle price action pattern on the daily timeframe. This breakout has shifted market sentiment towards a downtrend.
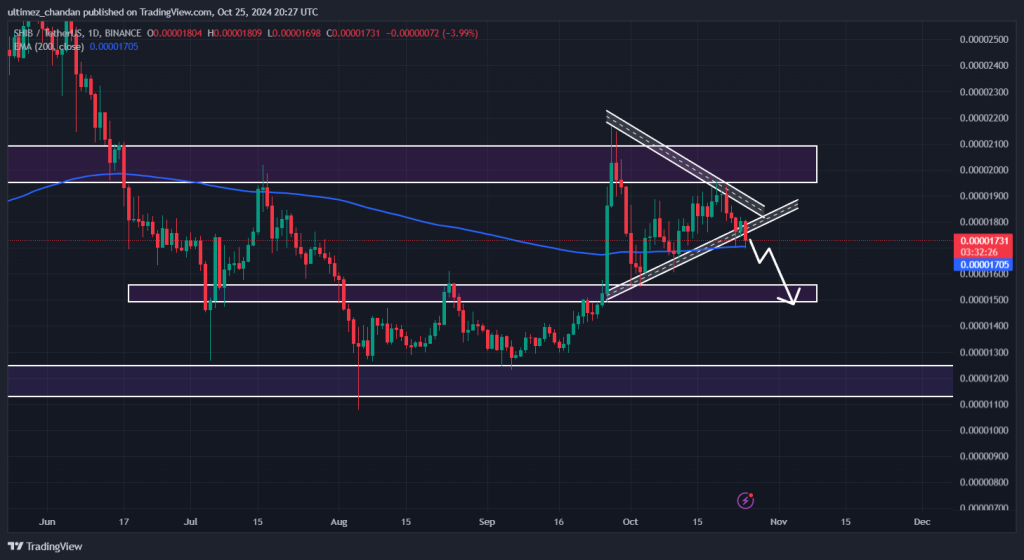
Despite the breakdown, SHIB is currently finding support at the 200 Exponential Moving Average (EMA) on the daily timeframe, suggesting a potential uptrend. However, if the meme coin breaks below and closes a daily candle under the 200 EMA, there is a high likelihood of a 15% decline, targeting the $0.000015 level in the near future.
The bearish scenario for SHIB will remain valid only if it closes a daily candle below the 200 EMA or the $0.000017 level; otherwise, it may prove to be inaccurate.
Bearish On-Chain Metrics
This negative outlook is further strengthened by on-chain metrics. According to the on-chain analytics firm Coinglass, SHIB’s Long/Short ratio currently stands at 0.869, the lowest since late September 2024. This ratio currently indicates a strong bearish sentiment among traders.
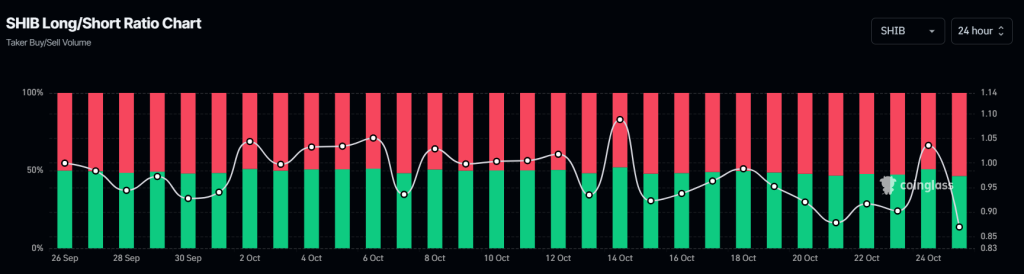
Furthermore, SHIB’s open interest has decreased by 7.67% over the past 24 hours, indicating a growing liquidation of long positions as the price continues to decline. Currently, 53.5% of top traders hold short positions, while 47.5% hold long positions.
Current Price Momentum
At the moment, SHIB is trading around $0.0000173 and has seen a price drop of more than 3.8% in the last 24 hours. During the same period, its trading volume has increased by 5%, indicating a rise in participation from traders and investors compared to the previous day.