Are you aware that properly preparing your data can enhance your model’s performance?
Techniques like normalization and standardization play a crucial role in scaling data correctly, leading to improved results and easier interpretation.
Curious to understand the distinction between these two techniques? Keep reading as we simplify it for you! But first, let’s grasp why data preprocessing holds significance in machine learning.
Data preprocessing in Machine Learning
In the realm of Machine Learning, Data preprocessing involves the process of readying raw data for ML algorithms. It encompasses steps like Data cleaning (rectifying incorrect or incomplete data), Data reduction (eliminating redundant or irrelevant data), and Data transformation (converting data to a preferred format).
This process is pivotal in ML as it directly impacts the performance and accuracy of the models. One common data preprocessing step in machine learning is Data scaling, where data values’ range is modified without altering the data itself.
Scaling data is essential before utilizing it for ML algorithms to ensure that features possess a comparable range, preventing those with larger values from overshadowing the learning process.
By adopting this approach, you can enhance model performance, achieve faster convergence, and improve interpretability. ML has the capability to detect any vulnerabilities or weaknesses in encryption methods, ensuring data security.
Definitions and Concepts
Data Normalization
In machine learning, data normalization transforms data features to a consistent range (0 to 1) or a standard normal distribution to prevent features with larger scales from dominating the learning process.
It is also referred to as feature scaling, aiming to make features comparable and enhance ML models’ performance, especially those sensitive to feature scaling.
Normalization techniques are utilized to rescale data values into a similar range, achievable through methods like min-max scaling (rescaling to a 0-1 range) or standardization (transforming to a zero-mean, unit-variance distribution). In ML, data normalization, min-max scaling transforms features to a specified range using the formula provided below-
Formula: X_normalized = (X – X_min) / (X_max – X_min).
Where:
X is the original feature value.
X_min is the min value of the feature in the dataset.
X_max is the max value of the feature in the dataset.
X_normalized is the normalized or scaled value.

Consider a dataset with two features: “Room” (ranging from 1 to 6) and “Age” (ranging from 1 to 40). Without normalization, the “Age” feature is likely to dominate calculations due to its larger values. Let’s illustrate how normalization works with a random value from the dataset: Room=2, Age=30
Before Normalization:
The scatter plot reveals that “Age” values are spread more expansively than “Room” values before normalization, making it challenging to identify any patterns between them.

After Normalization:
Utilizing the normalization formula X_normalized = (X – X_min) / (X_max – X_min), we obtain-
Room2_normalized = (2-1)/(6-1) = 3/5 = 0.6
Age30_normalized = (30-1)/(40-1) = 29/39 = 0.74
0.6 and 0.74 represent the new normalized values within the 0-1 range. Normalizing all feature values and plotting them would result in a distribution similar to the one below-

This scatter plot displays “Room” and “Age” values scaled to the 0 to 1 range, facilitating a clearer comparison of their relationships.
Data Standardization
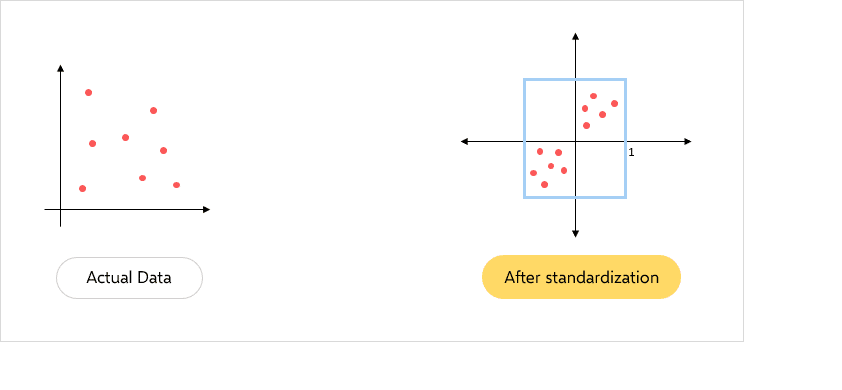
Data standardization, also known as Z-score normalization, is another data preprocessing technique in ML that scales features to have a mean of 0 and a standard deviation of 1. This technique ensures all features are on a comparable scale.
Standardization aids ML algorithms, particularly those sensitive to feature scaling like k-NN, SVM, and linear regression, in delivering improved performance. Additionally, it prevents features with larger scales from dominating the model’s output and renders the data more Gaussian-like, which is advantageous for certain algorithms.
Standardization transforms data by subtracting the mean of each feature and dividing it by its standard deviation. The formula is as follows-
Formula: X’ = (X – Mean(X)) / Std(X)
Where:
X is the original feature value.
X’ is the standardized feature value.
Mean(X) is the mean of the feature.
Std(X) is the standard deviation of X.


