The wider cryptocurrency market is still feeling the pressure today, with Bitcoin staying around the $66,000 mark following a significant correction. Sentiment is cautious, momentum is weak, and the focus is still on the recent drop in Bitcoin’s price. However, looking deeper into the data reveals a more nuanced story.
Various on-chain indicators are showing signs of nearing exhaustion levels historically associated with market bottoms rather than new downtrends. Liquidity is decreasing, accumulation patterns are changing, and risk-adjusted return metrics are approaching levels that have previously indicated the formation of price bottoms for Bitcoin. While this doesn’t confirm a reversal, it does suggest that the market might be entering a bottoming phase rather than heading towards a new bear market.
Here is a breakdown of the on-chain data:
Liquidity Contraction Resembles Previous Bottom Phases
The liquidity of stablecoins, which is crucial for the crypto market, is rapidly tightening. Over the last 60 days, the market capitalization of USDT has dropped by over $3 billion, pushing the 60-day change in market cap towards levels last seen during the 2022 capitulation event. Historically, sharp contractions in stablecoin liquidity indicate capital leaving the system during times of fear. However, past cycles have shown that when liquidity contraction reaches extreme negative levels and starts stabilizing, Bitcoin price bottoms often follow.
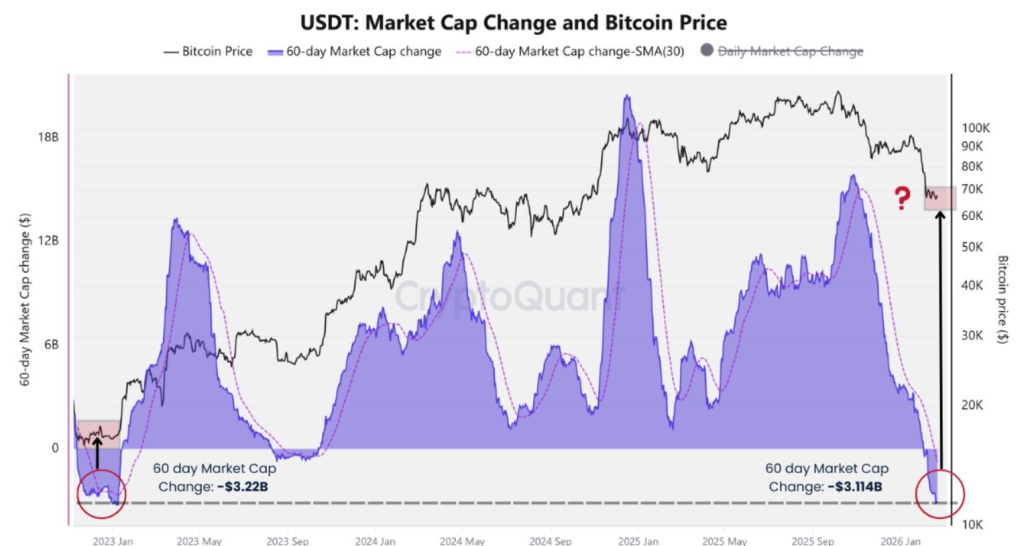
Similar liquidity contractions occurred during:
- The 2015 bear market low
- The 2019 mid-cycle reset
- The 2022 post-FTX capitulation
Liquidity plays a key role in driving market momentum. When the contraction slows down and inflows stabilize, prices usually react before sentiment improves. Currently, the market seems closer to exhaustion than expansion.
Smart Money Vs. Retail: Early Signs of Bottom Formation
Despite the recent crash in Bitcoin’s price making headlines, the behavior of supply-side participants tells a more complex story. Accumulation addresses, which historically receive BTC without significant distribution, are continuing to grow.
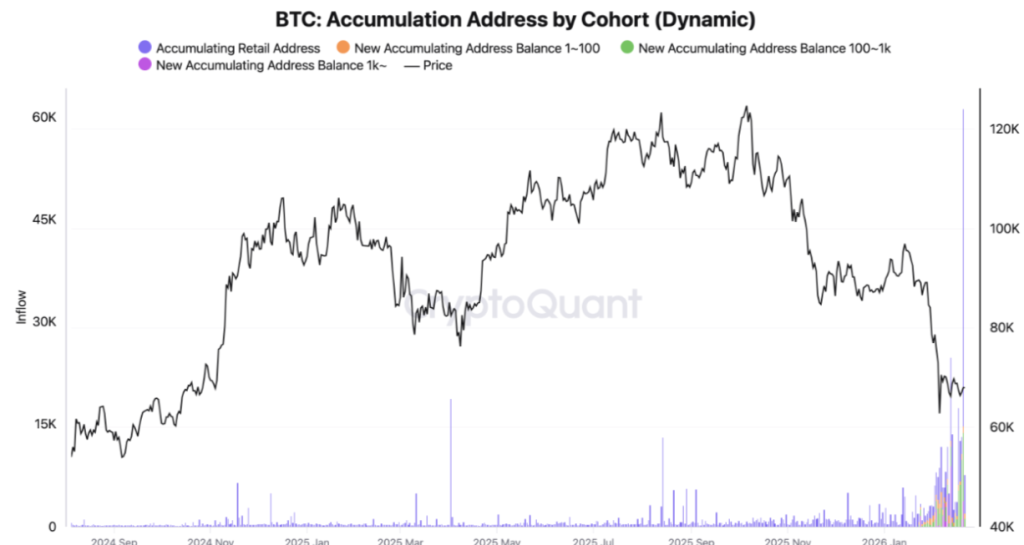
Data indicates that smaller holders are gradually increasing their share of the circulating supply, while the 30-day moving average of inflows into long-term holding wallets remains high. This suggests that smaller players are slowly absorbing supply around the $65K mark rather than selling off.
On the other hand, whale behavior is shifting, though not yet aggressively bullish. The cohort holding 10–10,000 BTC has reduced its selling intensity compared to previous weeks. This indicates that major sell pressure may be easing. Historical Bitcoin price bottoms usually go through stages where distribution slows down, absorption increases, and aggressive accumulation starts when volatility decreases.
The current behavior of Bitcoin seems to resemble the early stages of building a base rather than a complete reversal. Retail investors are slowly positioning themselves, while whales are moving from active selling towards a more neutral stance. This transition is often the initial step towards market stabilization.
Bitcoin’s Sharpe Ratio Approaches Historical Bottom Levels
One of the most notable signals comes from Bitcoin’s Sharpe Ratio. This ratio measures risk-adjusted returns, indicating how much return investors earn relative to the volatility of an asset. When the ratio falls deeply negative, it suggests poor short-term performance compared to the risk taken.
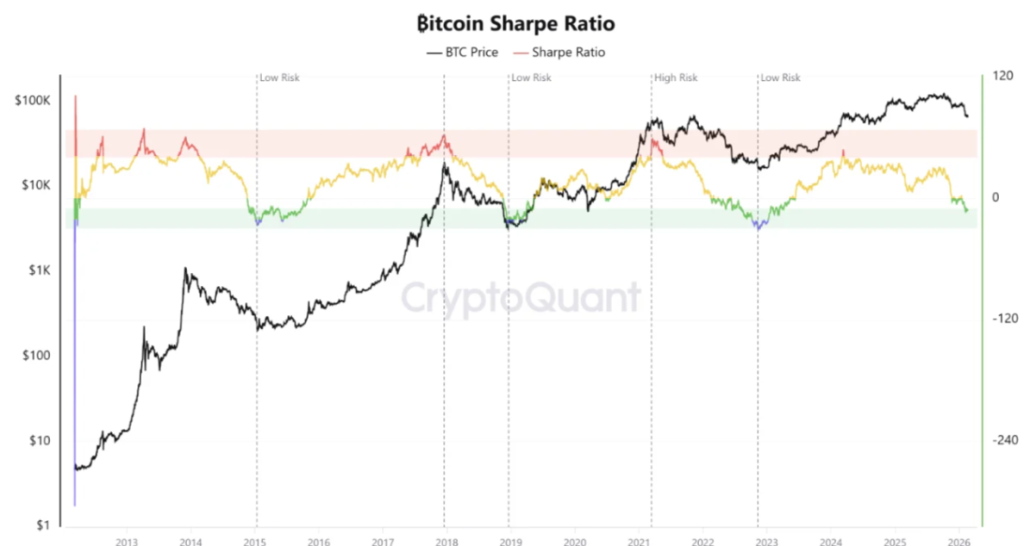
Historically, these deeply negative readings have aligned closely with:
- The 2015 macro bottom
- The 2019 reset
- The 2022 capitulation zone
Current readings are approaching the lower end of the historical range, often associated with phases of low-risk accumulation. While the Sharpe Ratio doesn’t predict the exact bottom, it does indicate when the risk-reward profile becomes favorable for long-term investments. Currently, this shift is approaching levels of historical significance.
Final Thoughts
The confirmation of a Bitcoin price bottom is still pending, but structural indicators suggest that the market is reaching a point of exhaustion. Liquidity is shrinking, accumulation is rising, and selling pressure is decreasing. If the market conditions stabilize around the mid-$60K range, the current phase may transition into a base formation instead of a further breakdown.
Trust with CoinPedia:
Since 2017, CoinPedia has been providing accurate and timely updates on cryptocurrency and blockchain developments. Our content is created by a team of experienced analysts and journalists who adhere to strict Editorial Guidelines based on E-E-A-T (Experience, Expertise, Authoritativeness, Trustworthiness). Each article is fact-checked against reliable sources to ensure accuracy, transparency, and credibility. Our review policy ensures impartial evaluations when recommending exchanges, platforms, or tools. We strive to deliver timely information on everything related to crypto & blockchain, from startups to major players in the industry.
Investment Disclaimer:
The opinions and insights shared in this article are the author’s own views on current market conditions. It is advisable to conduct your own research before making any investment decisions. Neither the writer nor the publication takes responsibility for your financial choices.
Sponsored Content and Advertisements:
Sponsored content and affiliate links may appear on our site. Advertisements are clearly marked, and our editorial content remains independent of our advertising partners.