Following a brief rally sparked by Consensus 2025 announcements, Pi Coin experienced a sharp 45% decline. On-chain data and indicators are pointing towards weakening momentum and a bearish outlook, unless new catalysts emerge.
Key Takeaways:
- Current Pi Coin price is $0.6984, down by 45% from its recent high.
- Market cap surged by 95% in 5 days, then plummeted by $3.7B in just 3 days.
- Top 100 wallet concentration dropped significantly from 98.76% to under 5% between May 6 and May 16.
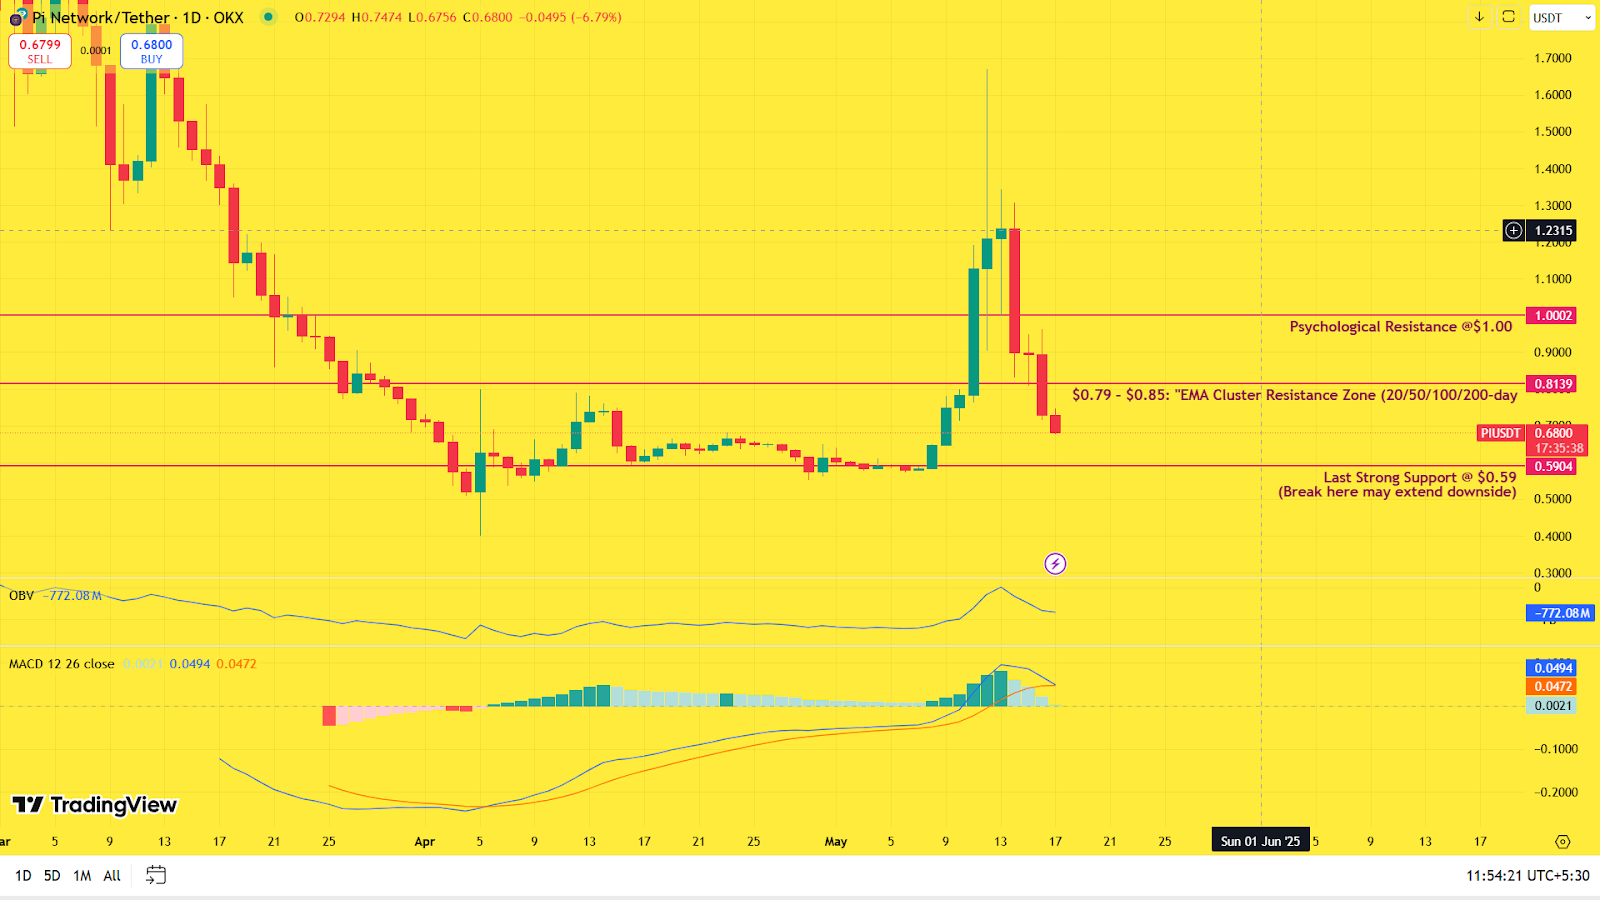
- EMAs at $0.79–$0.85 have now become resistance levels, confirming a bearish trend.
- Analysts remain cautiously bearish due to fading indicators and lack of support.
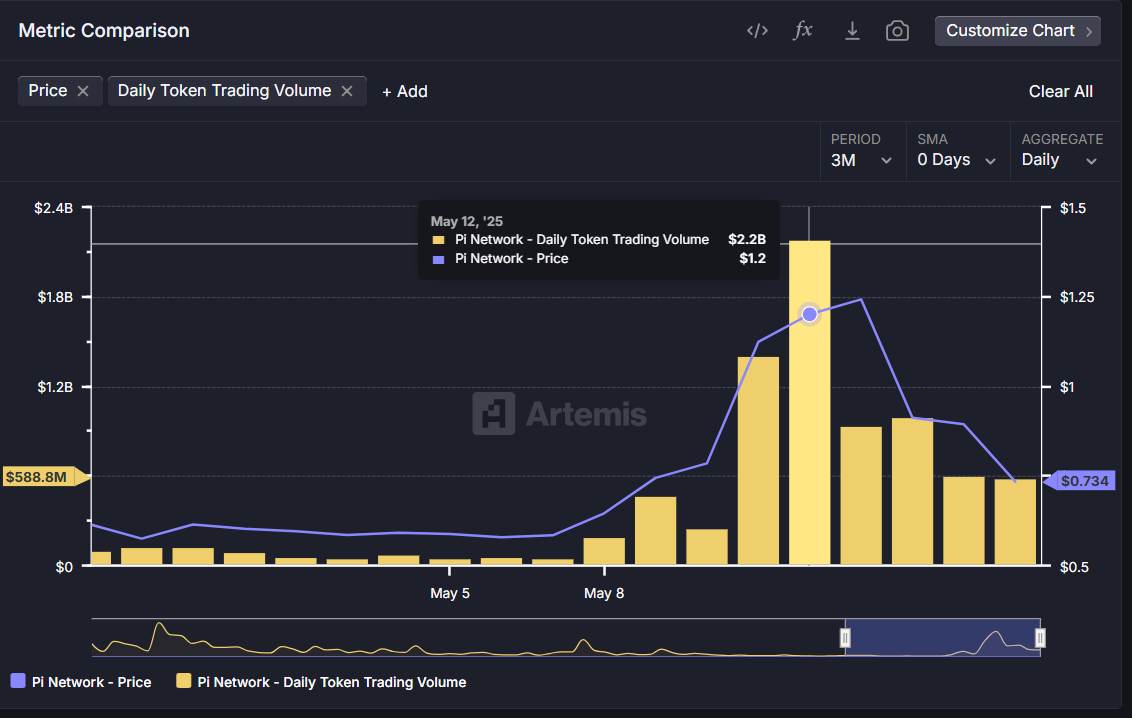
Currently, Pi Network (PI) is trading at $0.6984, a significant drop from its recent high of $1.57, with a market cap of $5.1B. The market cap of Pi surged from $4.5B to $8.8B between May 8 and May 13, almost doubling in just five days. However, by May 16, it had fallen back to $5.1B, losing over $3.7B in value in a span of three days.
The sudden decline followed a brief price increase triggered by major announcements, such as the shutdown of Pi’s central node and the launch of a $100M Pi Network Ventures fund during Consensus 2025 (May 13–14).
The rapid rise and fall demonstrate Pi’s susceptibility to news-driven price fluctuations rather than sustained growth. While the rally briefly captured the market’s attention, the subsequent sharp decline has increased caution among traders.
PI/USDT Technical Analysis: Indicators Point to Weak Momentum and Bearish Bias
The rally, which commenced on May 8 and saw Pi Coin surpass $1, reaching a peak of $1.57 on May 13, was driven by significant news. However, the buying momentum quickly dissipated.
Currently, Pi is trading below the 20, 50, 100, and 200-day EMAs in the range of $0.79–$0.85, which have now become resistance levels. The MACD has turned bearish, with the signal line inching closer to crossing below the main line. Although the histogram is not yet red, it is narrowing, indicating a decline in buying pressure. The RSI at 42 suggests a neutral-to-bearish momentum.
The On-Balance Volume (OBV) has dropped by over 12% from its recent peak, signaling a reduction in net accumulation. Resistance is observed at $0.79–$0.85.
Pi Coin is currently testing crucial support levels at $0.68 and $0.59, which were significant price zones before the May 8 rally. Instead of consolidating within a range, the price has dropped from its peak and is now stabilizing around previous levels where buyers had intervened, awaiting a new catalyst to propel it forward.
A breach below $0.59 could pave the way for a decline to $0.45. Analysis of the PI network remains cautiously bearish unless Pi manages to reclaim its EMAs with robust volume.
Pi On-Chain Metrics: Shift in Wallet Concentration and Volume Decline
 Post navigation