Ethereum is once again attempting to break through the crucial resistance zone above $2600 for the third time this month. Despite previous failed attempts, the current scenario suggests a potential shift as the volume decreases. The historical chart indicates an accumulation phase that may delay a breakout for the next few months.
The logarithmic regression band is a technical indicator used to identify trends in price movements. Currently, ETH price has entered these bands, hinting at a prolonged period within them. This pattern typically precedes a strong bullish wave and a new all-time high, following a consolidation period lasting about a year.
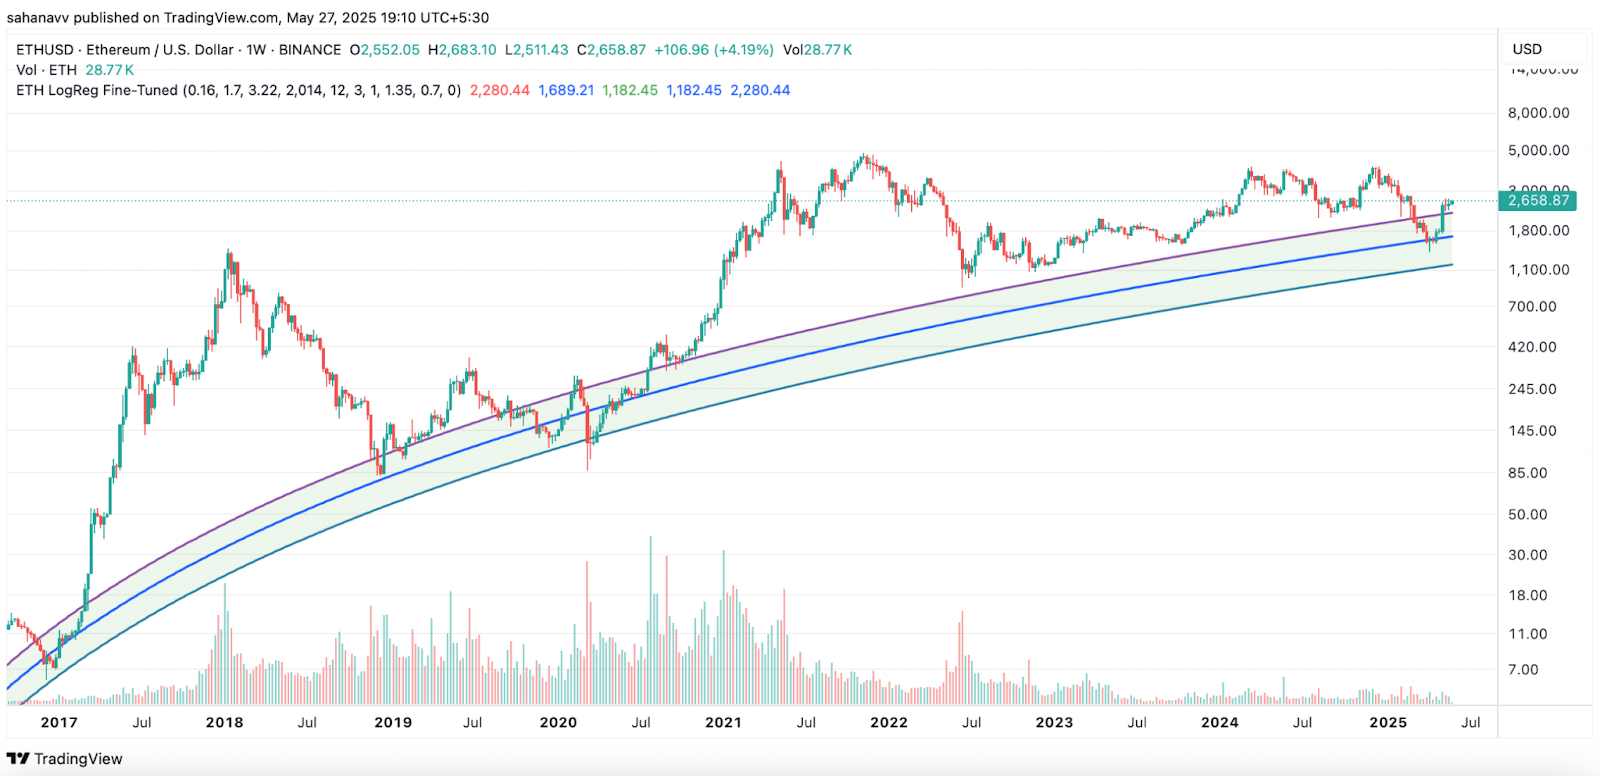
With ETH price now within the bands for the first time in years, a consolidation period is expected before the next bullish move. Despite four months of consolidation, another similar phase is anticipated before any significant breakout.
Will Ethereum (ETH) Fail to Surge Above $3000 in 2025?
Despite a recovery, ETH price has struggled to reach the bullish range. The weekly chart shows a v-shaped recovery but has yet to surpass the ascending trend line held since mid-2022. Technical indicators suggest a potential pullback in price.

Currently trading between the 50-day and 200-day weekly MA, ETH price is on track for a potential bearish crossover. Additionally, the weekly DMI indicates a strong downward trend, suggesting a pullback may keep prices below $2500 for a while. However, a breakout above this range could change the bearish outlook.