Following a period of volatility, the price of Bitcoin is currently consolidating above $115,000, indicating a crucial phase. Despite this, market participants remain optimistic as a significant force is poised to drive the BTC price rally. Global liquidity, as measured by M2, which represents the amount of money circulating in the world’s financial system, has reached a critical level where a bearish deviation could impact the BTC price rally.
At present, this liquidity is facing resistance, signaling limited growth in money supply. Bitcoin is reacting in a similar manner, trading sideways and awaiting a clear signal. A breakout in global liquidity could potentially fuel Bitcoin’s next major rally towards six figures. Conversely, if liquidity faces rejection once more, Bitcoin may remain in a prolonged consolidation phase.
Liquidity and Bitcoin: A Proven Correlation
For Bitcoin, liquidity often plays a crucial role in guiding significant movements. The M2 money supply, which measures the cash, savings, and near-money assets in circulation, has demonstrated a direct correlation with Bitcoin’s price over time.
Increased liquidity often benefits risk assets, as investors with more capital tend to explore non-traditional markets, such as Bitcoin, in search of higher returns. Conversely, when liquidity contracts due to stricter central bank policies, Bitcoin tends to struggle as speculative capital diminishes.
- 2017 Bull Run: A surge in credit growth and global liquidity propelled Bitcoin past $20,000 for the first time.
- 2020–2021 Rally: Unprecedented liquidity injections during the pandemic drove Bitcoin’s historic climb to $69,000.
- 2022 Crash: Tightening central bank policies and reduced liquidity caused Bitcoin to plummet to $15,000.
The pattern is evident: Bitcoin’s significant rallies and corrections have coincided with shifts in global liquidity. The current scenario, with liquidity facing long-term resistance, marks a crucial juncture not just for Bitcoin but for the entire crypto market.
What’s Next for the Bitcoin Price Rally?
Following a recent pullback, the BTC price experienced a notable decline from its highs, breaching key support levels. This breakout should not necessarily be viewed as a bearish reversal but rather as the start of a new bullish phase. The price remains above a crucial support level, and as long as bulls defend this zone, the potential for a bullish reversal remains high.
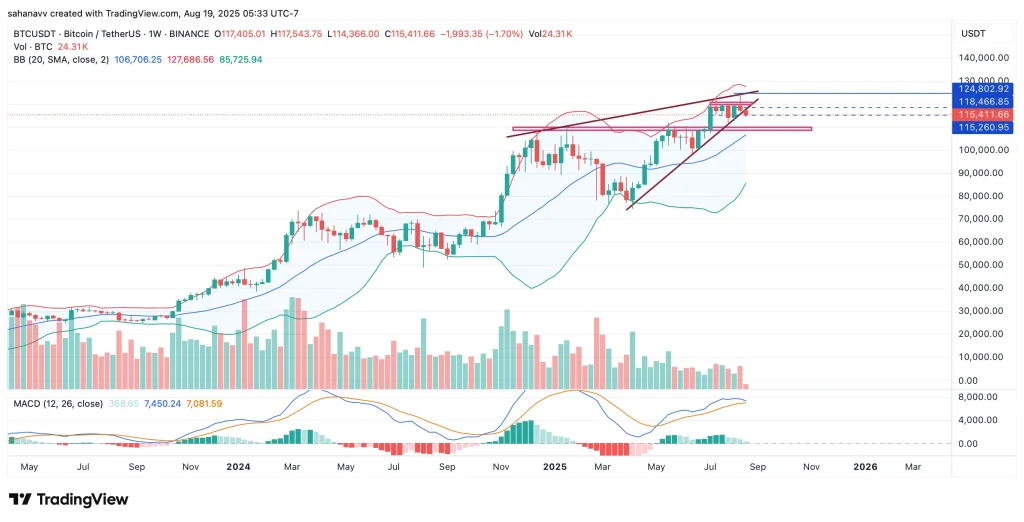
- Bitcoin is currently within a rising wedge pattern, typically a bearish formation, with price compression near the upper boundary, indicating a potential breakdown.
- Strong support lies around $115K–$118K, with key resistance near $124K–$127K— a breakout or breakdown will determine the next direction.
- The price is close to the upper Bollinger Band, reflecting strong momentum but also the risk of a pullback towards the middle band (~$106.7K).
- The MACD remains positive but is flattening, suggesting a slowdown in bullish momentum and the risk of a bearish crossover.
- Bitcoin continues to trade above the 20-week SMA (~$106.7K), which serves as long-term support in the bull market.
Bitcoin’s future hinges not only on adoption rates but also on global capital conditions. With liquidity at a critical juncture, traders should focus less on short-term fluctuations and more on the impending breakout. The M2 Liquidity Index could once again serve as a leading indicator of Bitcoin’s next major cycle— whether bullish or bearish.