
Machine learning datasets often have numerous features, which can lead to issues like redundant variables, increased computational costs, and difficulty in identifying patterns. Using all available features may not always yield better results.
Dimensionality reduction tackles this problem by representing data with fewer dimensions while retaining relevant information for the task.
Depending on the method used, this can involve identifying a smaller set of features, combining existing features into new representations, or mapping complex data into a lower-dimensional space.
Understanding these methods helps data scientists simplify datasets, visualize complex relationships, and create more efficient machine learning pipelines.
What Is Dimensionality Reduction in Machine Learning?
Dimensionality reduction refers to the process of reducing the number of features or dimensions in a dataset while retaining as much relevant information as possible.
In machine learning, each dimension typically corresponds to a feature or variable. For example, a customer dataset could include attributes like age, income, purchase frequency, and browsing activity, each contributing to the feature space.
Consider a dataset with 100 features. Some features may measure similar behaviors, while others may not contribute much to the prediction task. A dimensionality reduction method could transform these features into 15 components that capture the dataset’s key variation.
The goal is not to simply eliminate information but to find a more concise representation that makes the data easier to process, analyze, or model.
For instance, reducing the dimensionality of an image dataset with thousands of pixel values per image can help uncover patterns in the data or make computations more manageable.
However, fewer dimensions do not always equate to a better model. A reduction method might discard information crucial for prediction, so the resulting representation should be evaluated against the intended task.
Why Is Dimensionality Reduction Important?
Reducing the number of features can enhance the efficiency and interpretability of machine learning workflows. The benefits vary depending on the original dataset, the chosen technique, and the model being trained.
1. Reduce computational complexity
Operations in machine learning become more resource-intensive as the number of features grows. A smaller feature space can reduce memory requirements and speed up tasks like distance calculations, model training, and certain types of clustering.
This is especially beneficial for large datasets or high-dimensional data such as text embeddings and image representations.
2. Address the curse of dimensionality
As the number of dimensions increases, data points can become sparse relative to the feature space’s size. This can make methods like neighborhood relationships and distance-based calculations less effective without sufficient data.
Dimensionality reduction can help by producing a more compact representation, although it does not eliminate all challenges associated with high-dimensional data.
3. Reduce redundant information
Datasets often contain correlated features. For example, a customer’s monthly and annual spending might convey similar information.
Methods like Principal Component Analysis (PCA) can merge correlated variables into a smaller set of components, reducing redundancy without the need for manual selection of individual variables.
4. Improve data visualization
High-dimensional datasets are challenging to visualize directly. Techniques like t-SNE and Uniform Manifold Approximation and Projection (UMAP) can map data into two or three dimensions, making it easier to explore local patterns and potential clusters.
While these visualizations aid in exploratory analysis, separation in a plot does not always imply the same groups are separable in the original feature space.
5. Simplify downstream modeling
Some algorithms are sensitive to redundant features, noise, or the feature space’s geometry. A well-chosen reduction technique can enhance model performance or streamline training.
However, the impact varies by model. For instance, tree-based models may not benefit from PCA in the same way as linear or distance-based models. It’s crucial to measure performance rather than assume improvement.
How Does Dimensionality Reduction Work?
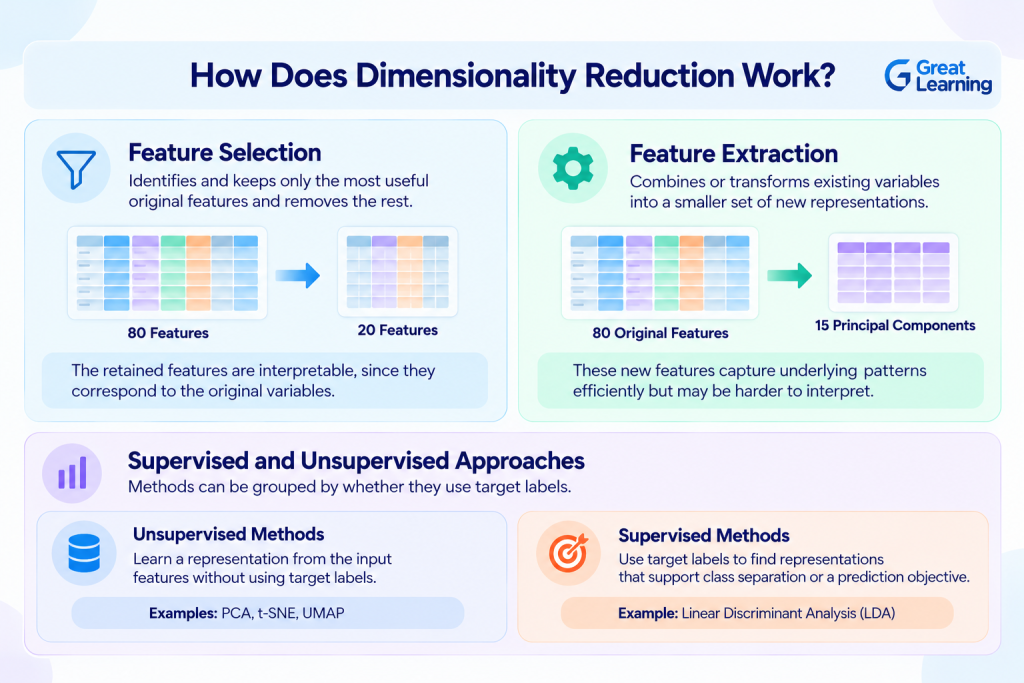
Dimensionality reduction generally follows two approaches: feature selection and feature extraction.
Feature selection retains a subset of the original variables, while feature extraction transforms existing variables into a smaller set of representations.
Feature Selection
Feature selection identifies the original features most useful for a specific task and discards the rest. For example, if a customer dataset has 80 features, a selection method might retain 20 relevant features.
The retained features remain interpretable as they correspond to the original variables. Techniques like filter-based feature selection, regularization, and model-based importance measures aid in this process.
Feature extraction, on the other hand, involves combining or transforming existing variables to create a lower-dimensional representation.
For example, PCA can convert 80 original features into 15 principal components, which are combinations of the original variables rather than selected columns from the initial dataset.
This approach efficiently captures underlying patterns, although the resulting components may be more challenging to interpret individually.
For practical experience with preprocessing, feature engineering, and model evaluation, consider exploring Great Learning Academy’s Python for Data Science and Machine Learning course.
Master Python for ML & Data Science
Learn Python for data science and machine learning to unlock endless opportunities. Its ease of use and powerful libraries help you transform data into insights & build intelligent systems seamlessly.
Enroll Now
Supervised and Unsupervised Approaches
Dimensionality reduction methods can be categorized based on their use of target labels.
- Unsupervised methods: These methods learn a representation from input features without utilizing target labels. Common examples include PCA, t-SNE, and standard UMAP.
- Supervised methods: These methods leverage target labels to identify representations that facilitate class separation or other defined prediction goals. Linear Discriminant Analysis (LDA) is one such example.
The choice of method depends on the specific task at hand. For exploratory visualization, an unsupervised method may be suitable, while a supervised method might be more appropriate for a classification problem where class separation is crucial.
Which Dimensionality Reduction Techniques Should You Know?
Different algorithms preserve different aspects of the original data. Some focus on overall variation, while others emphasize local neighborhoods or class separation.
| Technique | How it works | Best suited for | Main limitation |
| Principal Component Analysis (PCA) | Projects data onto directions capturing the most variance | General-purpose linear reduction and preprocessing | Components may be challenging to interpret |
| Truncated Singular Value Decomposition (SVD) | Factorizes a matrix into a smaller representation | Sparse, high-dimensional data, including text features | The reduced representation may lose valuable information |
| Linear Discriminant Analysis (LDA) | Finds projections that separate labeled classes | Supervised classification and visualization | Requires class labels and has a limited number of components |
| t-distributed Stochastic Neighbor Embedding (t-SNE) | Maps similar points into a lower-dimensional space, emphasizing local neighborhoods | Exploring high-dimensional data visually | Global distances and cluster sizes can be misleading |
| Uniform Manifold Approximation and Projection (UMAP) | Learns a lower-dimensional representation approximating neighborhood structure | Visualization and certain nonlinear reduction tasks | Results depend on parameters and may distort some relationships |
| Autoencoders | Utilize a neural network’s compressed representation to reconstruct its input | Complex, nonlinear data such as images or learned embeddings | Require training and careful architecture selection |
1. Principal Component Analysis (PCA)
Principal Component Analysis is one of the most commonly used dimensionality reduction techniques. It identifies data directions that capture the most variance and projects the original features onto those directions.
For instance, a dataset with 50 numerical features could be transformed into 10 principal components retaining 95% of the training data’s variance.
The 95% figure serves as an illustrative target, not a guarantee that 95% of predictive information is retained. Explained variance measures feature variation, not direct predictive utility.
Since PCA is sensitive to feature scale, standardizing numerical features is typically advisable when their units or ranges differ significantly.
Refer to the scikit-learn documentation on unsupervised dimensionality reduction for implementation specifics.
2. t-SNE and UMAP
t-SNE and UMAP are particularly helpful for visually exploring high-dimensional data. They can reveal local groups and neighborhood structures that are challenging to discern in the original feature space.
However, interpreting their visual outputs requires caution. In t-SNE, distances between well-separated clusters may not accurately reflect global distances in the original data.
UMAP, too, can distort some aspects of the original geometry based on the dataset and parameter settings.
For guidance, consult the scikit-learn t-SNE documentation and the official UMAP documentation.
How to Implement Dimensionality Reduction in Python
Python libraries like scikit-learn make integrating dimensionality reduction into a machine learning pipeline straightforward.
The following example uses Principal Component Analysis (PCA) to reduce the feature space of a classification dataset before training a Logistic Regression model.
Step 1: Import the necessary libraries
If scikit-learn is not already available in your environment, install it via the terminal:
pip install scikit-learn


Import the dataset, preprocessing, dimensionality reduction, and evaluation tools:


from sklearn.datasets import load_breast_cancer

from sklearn.model_selection import train_test_split

from sklearn.pipeline import Pipeline

from sklearn.preprocessing import StandardScaler

from sklearn.decomposition import PCA

from sklearn.linear_model import LogisticRegression

from sklearn.metrics import accuracy_score
Step 2: Load the dataset and split the data
Utilize the breast cancer dataset, extracting features and labels, then splitting them into training and testing sets:
# Load the feature matrix (X) and target vector (y)

X, y = load_breast_cancer(return_X_y=True)


# Split the dataset using stratification to maintain class balance

X_train, X_test, y_train, y_test = train_test_split(X, y, test_size=0.2, random_state=42, stratify=y)
The training set is used to fit preprocessing and reduction steps, while the test set is exclusively for evaluating the finalized model.
Step 3: Construct a PCA pipeline
Begin by standardizing the features, followed by employing PCA to preserve 95% of the training data’s variance, capped off with logistic regression:
# Construct an encapsulated processing and modeling pipeline

pipeline = Pipeline([

("scaler", StandardScaler()),

("pca", PCA(n_components=0.95, random_state=42)),

("classifier", LogisticRegression(max_iter=5000, random_state=42))

])
Here, n_components=0.95 instructs PCA to retain enough principal components dynamically to explain at least 95% of the global dataset variance.
The pipeline structure is crucial: the scaler and PCA are fitted solely on the training data to prevent test set information from influencing preprocessing.
Step 4: Train and evaluate the model
Fit the pipeline and evaluate its predictions:
# Fit the entire pipeline on the training data

pipeline.fit(X_train, y_train)


# Generate predictions on the unseen test data

predictions = pipeline.predict(X_test)


accuracy = accuracy_score(y_test, predictions)


# ADD THESE TWO LINES TO PRINT THE FEATURE COMPARISON:

print("Original Feature Dimensions:", X.shape[1], "features")

print("Number of PCA components retained:", pipeline.named_steps['pca'].n_components_)

print("Test accuracy:", accuracy)
Output:
Original Feature Dimensions: 30 features

Number of PCA components retained: 10

Test accuracy: 0.9736842105263158
The displayed accuracy varies based on the dataset and model configuration. Avoid assuming a particular score without executing the code. The component count indicates how many compressed dimensions PCA retained to meet the chosen variance threshold.
Step 5: Compare against a model without PCA
It’s vital to evaluate dimensionality reduction rather than assume performance enhancement. Train a baseline pipeline using the same data split and classifier, excluding the PCA component extraction step:
# Construct a baseline pipeline excluding the dimensionality reduction step

baseline = Pipeline([

("scaler", StandardScaler()),

("classifier", LogisticRegression(max_iter=5000, random_state=42))

])


# Fit and assess the baseline model

baseline.fit(X_train, y_train)


baseline_predictions = baseline.predict(X_test)


baseline_accuracy = accuracy_score(y_test, baseline_predictions)


print(f"Baseline accuracy: {baseline_accuracy:.4f}")
Output:
Baseline accuracy: 0.9825
Compare both models using the same test split. For a more robust evaluation across different complex datasets, employ cross-validation and consider metrics like precision, recall, F1-score, or ROC-AUC when accuracy alone is insufficient for addressing class imbalance.
This process aids in determining whether reduction optimizes computational efficiency and storage while maintaining acceptable predictive performance.
Expected Terminal Outputs
Upon running this verified script on the Breast Cancer dataset, you should observe the following results:
- Original Feature Dimensions: 30 features
- Number of PCA components retained: 10 components (A 66.6% reduction in feature footprint!)
- Test accuracy (With PCA): 0.9825 (98.25%)
- Baseline accuracy (Without PCA): 0.9825 (98.25%)
To enhance your expertise beyond individual machine learning techniques, consider exploring the Artificial Intelligence course from Texas McCombs School of Business, encompassing machine learning, deep learning, generative AI, and practical AI applications.
Applications, Limitations, and Best Practices
Dimensionality reduction proves valuable in several machine learning applications, but its efficacy hinges on selecting the right method and evaluating information loss during compression.
Common Applications
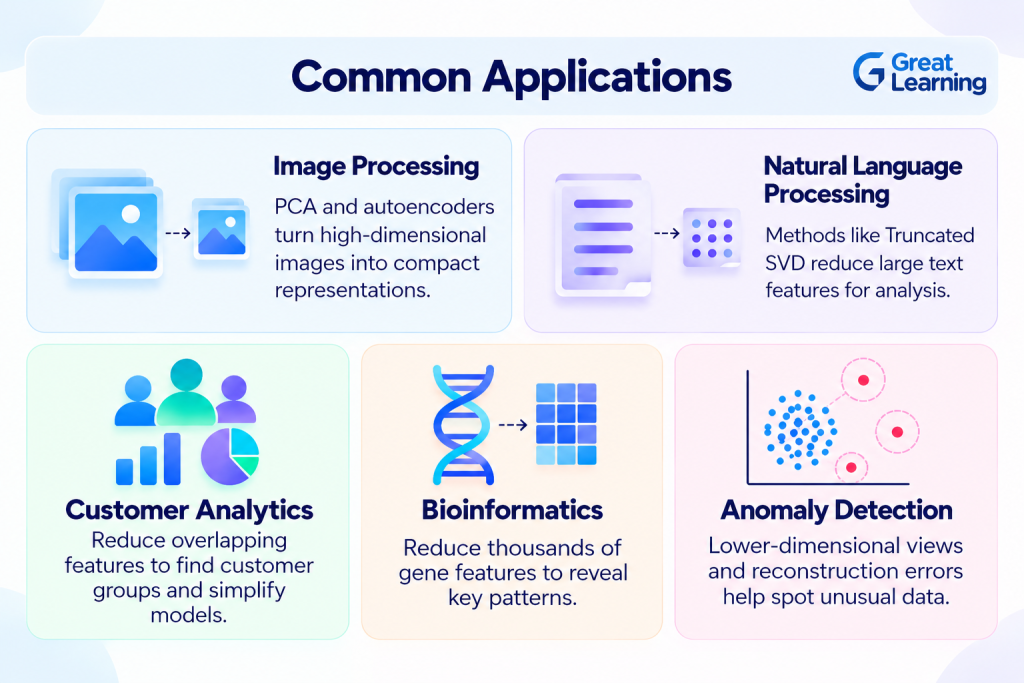
Image Processing: Dimensionality reduction techniques like PCA and autoencoders can create compact representations for image analysis or downstream modeling.
Natural Language Processing: Text data represented through large sparse matrices, such as TF-IDF features, can leverage methods like Truncated SVD for reduction. Dense text embeddings may also be reduced for visualization or specialized tasks.
Customer Analytics: Streamlining overlapping behavioral features can aid analysts in exploring customer segments and simplifying predictive models.
Bioinformatics: Gene expression datasets may contain numerous measurements across a small number of samples. Reduction techniques can uncover broad patterns, but validation is critical to avoid losing biologically significant signals.