Approaching the significant $600 mark, the Binance Coin (BNB) price is on the verge of a crucial turning point. The resistance at this level has been a major hurdle in the daily chart, halting the bullish momentum.
Will the recent uptrend lead to a breakout towards $800? Let’s delve into Coinpedia’s analysis of BNB price.
Binance Coin (BNB) Performance
The daily chart for BNB shows a rising support trend line, which is supporting the bullish trend. The price of BNB is currently testing a key resistance zone near the $600 mark, resulting in higher highs.
Since June, this resistance zone has prevented BNB from breaking out, leading to several bearish reversals. After finding support at $464, the price has been moving sideways.
Despite the sideways movement, there is an underlying bullish trend forming an ascending triangle pattern. The current bullish cycle within this pattern is challenging the supply zone with three consecutive bullish candles and a 5.78% increase.
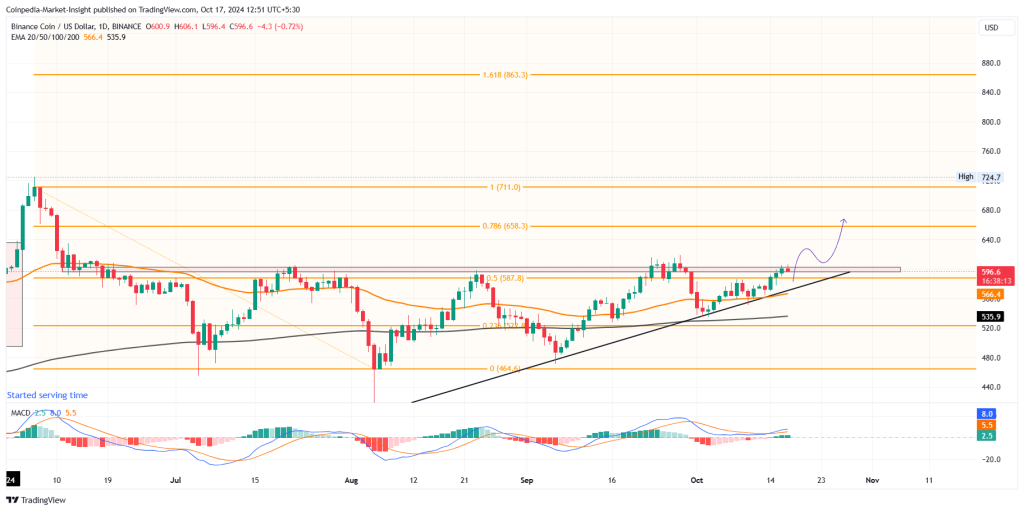
However, a minor intraday pullback of 0.67% along with higher price rejection signals a possible failure of the bullish move. As the price approaches the apex of the pattern, the market is anticipating a breakout.
Technical Indicators Supporting Breakout
With the overall bullish sentiment in the crypto market, BNB is likely to break above $600 with the support of the rising trend line. The 50-day and 200-day moving averages are in a positive alignment, providing dynamic support for a potential breakout.
Additionally, the MACD and signal lines have recently crossed over to the bullish side, accompanied by an increase in positive histograms. These technical indicators indicate a strong underlying bullish trend, enhancing the probability of a breakout.
Will Binance Surpass $600?
Based on Fibonacci levels, the uptrend has surpassed the 50% level at $587, but the crucial hurdle remains at $600. If the ascending triangle breakout occurs, the next targets could be at 78.60% or 100% levels at $658 or $711 by the end of the month.
In the long term, the 1.618 Fibonacci level at $863 could be a potential target if the bullish trend continues. On the downside, key support levels are at 23.60% Fibonacci level at $522, slightly below the 200-day EMA at $535.
Excited to know if BNB will reach $1,000? Explore Coinpedia’s Binance Coin (BNB) price prediction now.