It has been a volatile start to the week for Ethereum, with indications suggesting that further declines could be on the horizon. As Bitcoin loses steam and falls below immediate support levels, the selling pressure on Ethereum is mounting. Various on-chain metrics are pointing towards a potential sharp 10% drop for Ethereum in the coming hours.
Ethereum Eyes for 10% Drop
Coinglass data shows that Ethereum liquidations have seen a significant surge, exceeding $42.7 million in total. Long positions account for approximately $40 million of this total.
One bearish sign is the growing supply of ETH on exchanges. CryptoQuant data reveals that Ether balances on exchanges hit a four-week high of 15.8 million ETH on October 21. The net balance between inflows and outflows in centralized exchange wallets has seen a notable increase between October 15 and October 20, coinciding with a spike in deposits to trading platforms.
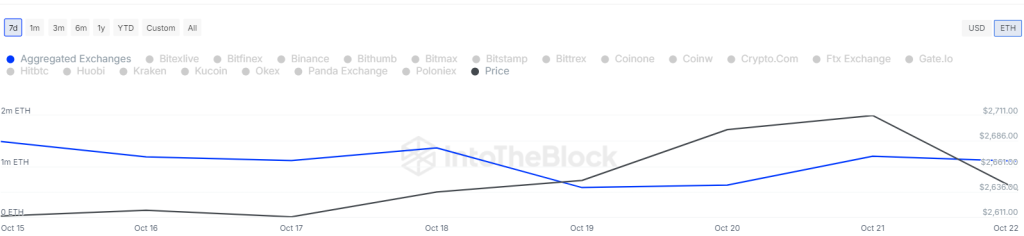
The increase in ETH supply on exchanges indicates that investors are moving their tokens from self-custody wallets to exchanges, signaling an intent to sell.
Moreover, Ethereum’s total value locked (TVL) has been declining since mid-June, as illustrated in DefiLlama’s chart below.
The TVL on the layer-1 network dropped from a year-to-date peak of $66 billion on June 3, falling 57% to $42.3 billion by August 5, before rebounding to the current level of $48 billion. DefiLlama data indicates that Ethereum’s TVL has decreased by over 2% in the last 30 days, lagging behind other major layer-1 protocols like Solana, which has seen a 22% increase in TVL during the same period.
The rising TVL in Solana reflects traders’ interest in its DeFi ecosystem and underscores Ethereum’s challenges in attracting new users due to its relatively higher transaction costs, especially for those looking to initiate new projects.
These factors have intensified the bearish sentiment in Ethereum’s price chart, pushing the price towards a potential 10% decline.
What’s Next for ETH Price?
Ether price has faced significant selling pressure as bears have dominated around $2,800, indicating a rejection of the previous breakout. This pressure has led to a drop below the 200-day Exponential Moving Average (EMA) at $2,552. Presently, ETH price is trading at $2,517, marking a decline of over 4% in the last 24 hours.
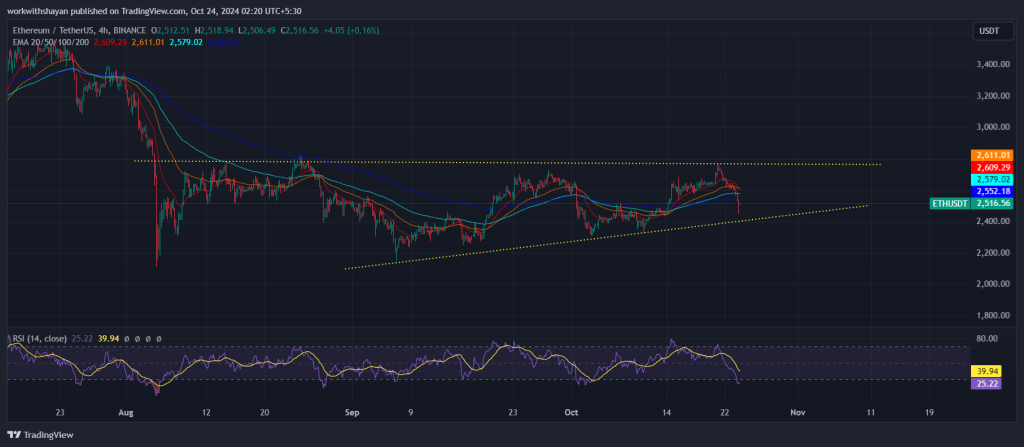
There is minor support at the 50-day Simple Moving Average (SMA) of $2,487; however, a failure to hold this level could see the ETH/USDT pair dropping to $2,400 and potentially to $2,330.
On the flip side, a bounce off the 50-day SMA would indicate strong demand at lower price levels. In that scenario, bulls may aim to push the price towards $2,850, a key resistance level.
With the RSI level nearing oversold territory, a rebound in the ETH price chart could be on the horizon.