Bitcoin’s stability around $62,941 conceals a divergence in Bitcoin futures positioning: a breakout to the downside or the upside could gather momentum from forced trades.
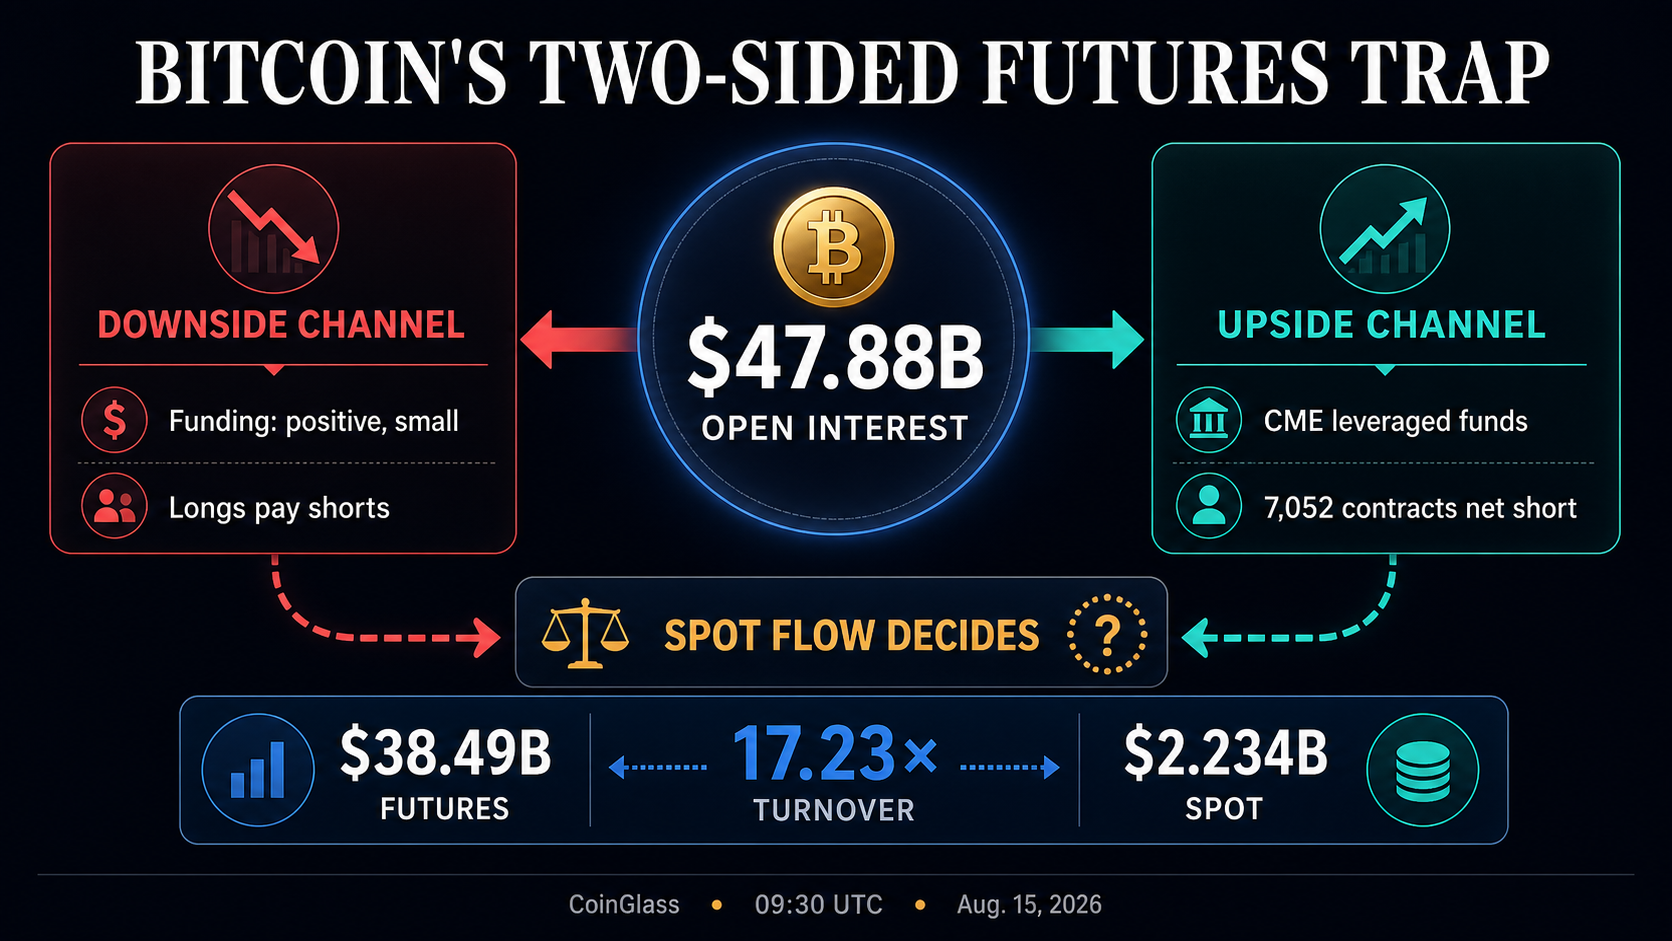
As of 09:30 UTC on Aug. 15, CoinGlass reported $47.88 billion in Bitcoin open interest, with $38.49 billion in 24-hour futures volume and $2.234 billion in spot volume. Futures turnover was 17.23 times CoinGlass’s spot volume during the same time frame.
The ratio indicates the relative trading activity. Open interest represents outstanding contracts, with each contract having a long and a short position. This aggregate leaves the direction unresolved.
There is a divergence in directional indicators across different markets. While small positive funding on offshore perpetuals exposes longs in the event of a price drop, a significant net-short position among CME leveraged funds could lead to demand for covering if the price rises. The side that is forced to retreat first will depend on which range boundary attracts enough demand or supply from the cash market to keep Bitcoin moving.
Bitcoin futures positioning indicates conflicting directions
| Signal | Observed state | Potential forced flow |
|---|---|---|
| CoinGlass activity | $47.88B open interest; futures volume 17.23 times its spot measure | A sustained range break can transmit through a large derivatives market |
| Offshore funding | Positive but small on OKX and Deribit | Falling prices can prompt leveraged longs to close |
| CME positioning | Leveraged funds net short 7,052 outright standard contracts | Rising prices can prompt short covering |
| US spot ETF flows | -$385.2M from Aug. 10-14; +$480.1M from Aug. 3-14 | Recent demand weakened within a still-positive wider August window |

Funding provides a clear downside channel. OKX reported a current-period BTC-USDT perpetual rate of about 0.00752%, while Deribit showed a slightly positive eight-hour rate in the snapshot. Positive rates indicate that long positions paid shorts on those instruments.
A price decline combined with position closures could result in those longs becoming additional sellers. A decrease in open interest and a funding reset during such a movement would further indicate ongoing deleveraging.
These rates were specific to the venues and showed a potential path for a long unwind, but the extent of widespread long positioning remains uncertain.
CME positioning presents the opposite scenario. CFTC data for Aug. 11 showed leveraged funds holding 4,997 outright long and 12,049 outright short standard CME Bitcoin futures contracts. The resulting net short position was 7,052 contracts, equivalent to 35,260 BTC of contract face value, alongside 1,958 spread positions. Asset managers held a net 2,234 outright long contracts alongside 157 spreads.
If Bitcoin breaks out of its range, leveraged funds reducing short exposure would add to the buying pressure in futures. The weekly figures reflect CME positions as of Tuesday’s close and lag behind the live market by four days. The classification also encompasses strategies like basis trades and hedges, making the intent and liquidation price of individual positions uncertain.
When combined, the offshore and CME snapshots illustrate how Bitcoin futures positioning exposes different groups to vulnerability. Offshore funding indicates a potential long-unwind scenario, while CME positioning suggests a possible short-covering scenario.
Spot demand will determine the first casualty
US spot Bitcoin ETF flows highlight the uncertainty surrounding the trigger. Farside Investors recorded net outflows totaling $385.2 million from Aug. 10 to Aug. 14, signaling a shift from previous net demand.
Despite recent weakening ETF demand, the broader August period maintained a positive balance. Flows from Aug. 3 to Aug. 14 remained net positive at $480.1 million following strong inflows earlier in the month. A downside scenario could become more likely if selling pressure persists, pushing Bitcoin through the range while positive funding and open interest contracts remain. Conversely, an upside scenario would gain momentum if cash-market or ETF demand returns alongside futures shorts covering. Price movements, spot activity, and changes in open interest need to align for either scenario to dominate.
Liquidation maps can indicate where forced activity might intensify, but CoinGlass’s methodology calculates these zones based on market data and leverage assumptions. They offer conditional estimates rather than predefined orders.
As a result, the situation remains balanced. Bitcoin’s substantial derivatives exposure could fuel a range breakout through position closures, but the available evidence does not pinpoint a definitive cascade threshold within 1% or 2% of the spot price. A significant move would only accelerate if it breaches concentrated margin levels and garners follow-through from the cash market. Until these conditions materialize, Bitcoin futures positioning remains uncertain, with both longs and shorts susceptible to forced exits.